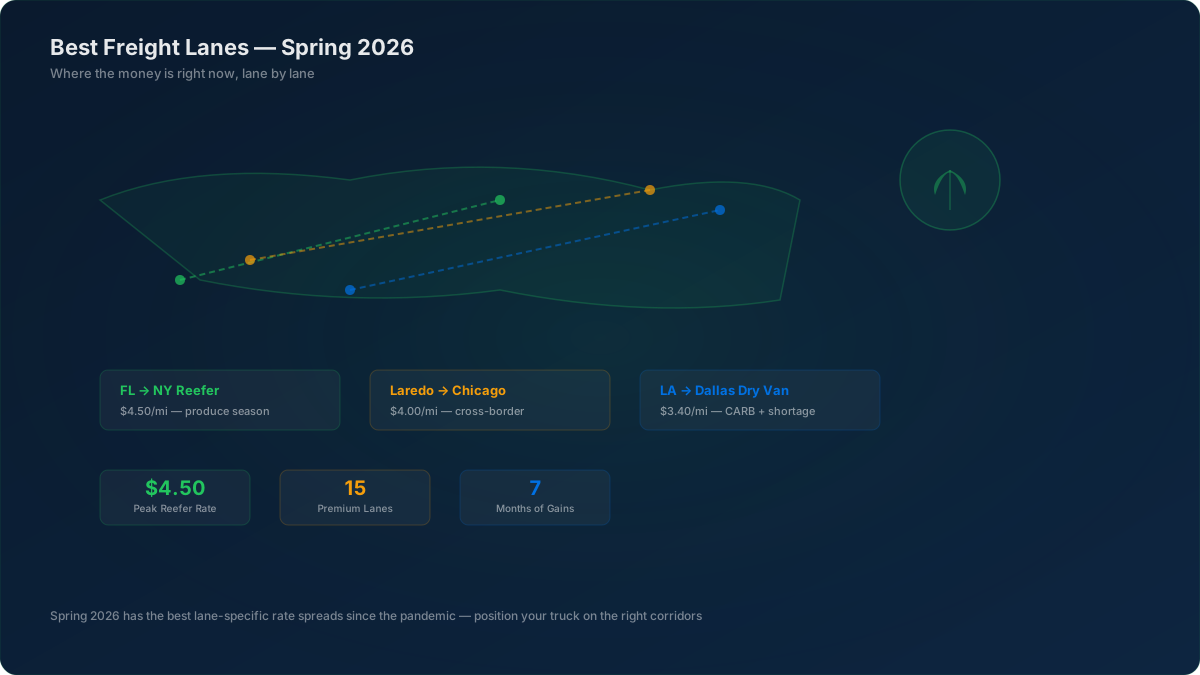
Fall 2026: Rate Recovery Is Real — Lane Selection Still Decides Your Week
The 2023–2024 freight recession thinned capacity hard. By mid-2026 the survivors are finally getting paid for it: DAT national dry van spot averaged about $3.00 per mile including fuel in July 2026 (weekly reading $3.06 for June 28–July 4), after dry van spot passed contract in June 2026 for the first time since February 2022. Early-year February prints near $2.41/mi are historical context now — not a live quote.
National averages still lie. Southeast van can clear near $3.20 while Northeast soft spots sit closer to $2.45 on the same week. Reefer harvest spikes, Laredo northbound, CARB-constrained California outbound, and Q4 retail DC freight will out-earn a random Midwest short-haul every time. This Fall 2026 refresh keeps the spring corridor map, updates the rate math, and adds the September–December positioning playbook.
$3.00
DAT van spot avg (July 2026)
15%+
OTRI since mid-May 2026
9.38
Van load-to-truck (July)
$5.26
EIA diesel (week of Aug 10)
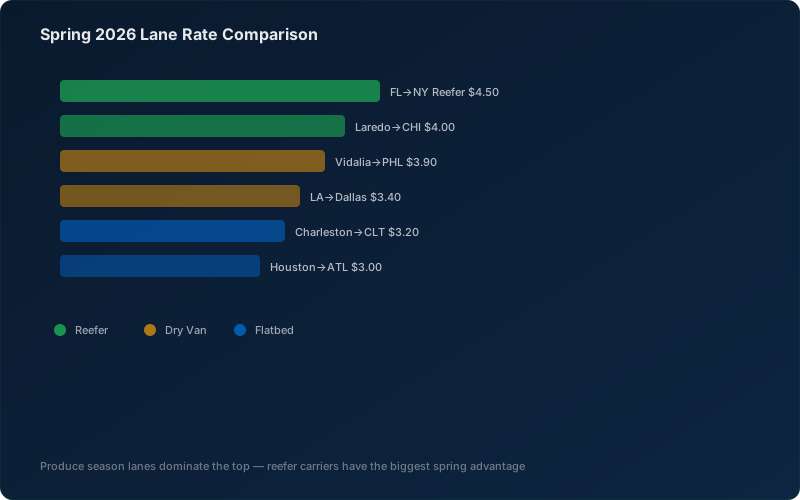
Top 15 Freight Lanes by Rate — 2026 (Peak Window Benchmarks)
These origin-destination pairs posted the strongest paid windows in 2026 peak periods, based on DAT spot data, FreightWaves SONAR, and broker feedback across spring harvest and mid-year recovery. Re-check live DAT before you book — these are dated benchmarks, not standing offers.
| # | Origin | Destination | Equipment | Rate/Mi | Driver |
|---|---|---|---|---|---|
| 1 | Plant City, FL | New York, NY | Reefer | $4.50 | Produce season |
| 2 | Immokalee, FL | Boston, MA | Reefer | $4.30 | Produce season |
| 3 | Laredo, TX | Chicago, IL | Reefer | $4.00 | Cross-border |
| 4 | Vidalia, GA | Philadelphia, PA | Reefer | $3.90 | Produce season |
| 5 | Laredo, TX | Dallas, TX | Dry Van | $3.80 | Cross-border |
| 6 | Lumberton, NC | New York, NY | Reefer | $3.70 | Produce season |
| 7 | El Paso, TX | Kansas City, MO | Reefer | $3.60 | Cross-border |
| 8 | Los Angeles, CA | Dallas, TX | Dry Van | $3.40 | CARB + shortage |
| 9 | Long Beach, CA | Phoenix, AZ | Dry Van | $3.30 | Port freight |
| 10 | Charleston, SC | Charlotte, NC | Flatbed | $3.20 | Construction |
| 11 | Fresno, CA | Seattle, WA | Reefer | $3.10 | Produce season |
| 12 | Houston, TX | Atlanta, GA | Flatbed | $3.00 | Energy + construction |
| 13 | Phoenix, AZ | Denver, CO | Flatbed | $2.95 | Construction |
| 14 | Tampa, FL | Nashville, TN | Flatbed | $2.90 | Infrastructure |
| 15 | Savannah, GA | Memphis, TN | Dry Van | $2.85 | Port distribution |
Rates reflect all-in spot-style averages including fuel from 2026 peak windows (spring harvest / mid-year recovery). Actual offers vary by day, broker credit, and your equipment.
Reefer: Southeast Produce Corridors ($3.50-$4.50/mi)
Every spring, the Southeast becomes the epicenter of reefer freight — and 2026 is no exception. Florida's strawberry season (Plant City) kicked off in January and runs through April. Tomato country (Immokalee, Homestead) ships from December through June. Georgia's Vidalia onion harvest starts in April. The Carolinas ship sweet potatoes, blueberries, and peaches from April through July.
The money lanes run northbound. Plant City to New York is the crown jewel, consistently paying $4.00-$4.50 per mile during peak strawberry weeks (mid-March through mid-April). Immokalee to Boston runs $3.80-$4.30. Vidalia to Philadelphia hits $3.50-$3.90 during the onion harvest. These rates are driven by two factors: the loads are time-sensitive (produce spoils), and the demand is concentrated in a short window.
How to position: Get your reefer into Central Florida by late February. Build relationships with produce brokers before season starts — the best loads go to known carriers first. Make sure your reefer unit is serviced and holding temperature, because a breakdown during a $5,000 produce load is a career-defining loss. See our produce season guide for a month-by-month harvest calendar.
Cross-Border: Laredo and El Paso ($3.00-$4.00/mi)
Laredo, Texas is the busiest commercial land port in the Western Hemisphere, processing 14,000-16,000 truck crossings daily. Nearshoring — the trend of companies moving manufacturing from Asia to Mexico — has been accelerating since 2020, and the freight volumes flowing through Laredo and El Paso reflect that shift. Northbound rates from Laredo are running $3.00-$4.00 per mile in Spring 2026, with reefer freight (produce and perishable imports) at the top of the range.
The Laredo-to-Dallas lane (approximately 450 miles) is paying $3.50-$3.80 per mile for dry van and $3.80-$4.00 for reefer. Laredo-to-Chicago (approximately 1,400 miles) runs $3.00-$3.50 per mile but offers higher per-load revenue ($4,200-$4,900). El Paso-to-Kansas City and El Paso-to-Denver are strong secondary lanes at $3.00-$3.60 per mile.
The catch: Southbound backhaul to Laredo is weak, typically $1.50-$2.00 per mile. The smart play is to pick up a Dallas or San Antonio to Laredo backhaul rather than deadheading south. Some carriers run triangular routes — Laredo to Dallas (northbound, paid), Dallas to Houston (short hop, decent rate), Houston to Laredo (backhaul, lower rate but avoids deadhead). Our deadhead calculator can help you compare route options.
Dry Van: California Outbound ($3.00+/mi)
California is one of the most expensive places to operate a truck in the country. CARB (California Air Resources Board) regulations require 2010 or newer engines for trucks operating in the state, which has pushed older trucks and their owners out of the California market. Add in the persistent driver shortage, high fuel costs, and congested ports at LA and Long Beach, and you have a recipe for elevated outbound rates.
LA to Dallas is paying $3.20-$3.40 per mile for dry van. Long Beach to Phoenix runs $3.00-$3.30. Fresno and the Central Valley to Pacific Northwest markets are hitting $3.00-$3.10 for reefer. Even the traditionally weaker LA to Salt Lake City lane is running above $2.80 per mile.
What's driving it: Beyond CARB, the port of Los Angeles handled a surge of front-loaded imports in Q1 2026 as shippers pulled goods forward ahead of potential tariff increases. That import wave translates directly into outbound truck freight as containers are deconsolidated and shipped domestically. If you have a CARB-compliant truck and can handle California's operating environment, the rates reward you for it.
Flatbed: Construction Corridors ($2.80-$3.40/mi)
The Infrastructure Investment and Jobs Act continues to pump billions into highway, bridge, and utility projects across the Southeast and Southwest. Construction spending remains a primary flatbed demand driver into Fall 2026, and the rates reflect it. Southeast lanes (Charleston to Charlotte, Houston to Atlanta, Tampa to Nashville) are averaging $2.80-$3.20 per mile. Southwest corridors (Phoenix to Denver, Las Vegas to Salt Lake City) run $2.80-$3.40 per mile.
Flatbed rates are less volatile than reefer or dry van because construction projects run on multi-year timelines, not seasonal spikes. The downside is that flatbed loads often involve more work — tarping, securing, loading/unloading time — and your operating costs are higher due to equipment wear. But for carriers who can handle the work, flatbed offers the most consistent premium rates of any equipment type in the current market.
Pro tip: Steel and building materials from Houston, Birmingham, and Charlotte-area mills are the bread-and-butter flatbed loads. Construction sites in fast-growing metros (Phoenix, Nashville, Raleigh, Austin) need steady flatbed capacity. Position near supply sources rather than delivery sites — you want to be where the loads originate, not where they terminate. Check our seasonal freight calendar for construction peak periods by region.
Lanes to Avoid in Spring 2026
Not every lane is worth running. Here are the corridors where you are burning fuel and time for below-average returns:
| Lane | Rate/Mi | Why It's Weak |
|---|---|---|
| Midwest → Midwest (dry van) | $1.80-$2.20 | Oversupplied, short distances, low per-load revenue |
| Anywhere → Florida (backhaul) | $1.20-$1.60 | Every northbound produce truck needs a ride south |
| Anywhere → Laredo (backhaul) | $1.50-$2.00 | Heavy southbound competition from cross-border trucks |
| Northeast → Southeast (dry van) | $1.90-$2.30 | Freight imbalance favors northbound |
| Inbound California (dry van) | $1.70-$2.10 | CARB compliance costs not offset by inbound rates |
If your home base is in one of these weak markets, you have two options: either reposition to a hot market (invest one deadhead run to get into a profitable corridor) or work with a professional dispatch service that can find the best available rates on even weaker lanes. Sometimes the best load is not the highest-paying one — it is the one that positions you for a high-paying follow-up.
Backhaul Strategies That Actually Work
The difference between a carrier grossing $6,000/week and $9,000/week is usually not the headhaul rate — it is what they do on the backhaul. Here are proven strategies for the top Spring 2026 corridors:
FL produce northbound: After delivering in the Northeast, pick up retail or manufacturing freight from NJ/PA to the Carolinas or Georgia. Then pick up another produce load heading north. This loop keeps you earning on every leg instead of deadheading 1,000+ miles back to Florida.
Laredo cross-border: Run a triangular route. Laredo to Dallas (paid, $3.50+/mi), Dallas to Houston or San Antonio (short hop, $2.50-$3.00/mi), then backhaul to Laredo ($1.80-$2.20/mi). Three paid legs are always better than one premium leg and a deadhead return.
California outbound: After delivering in Phoenix, Dallas, or Denver, look for return loads through secondary markets rather than heading straight back to LA. Phoenix to Tucson to El Paso, or Denver to Salt Lake City to Reno — these routes pass through freight markets where you can pick up loads heading west.
Use our deadhead calculator and cost per mile calculator to compare backhaul options against deadhead costs. Sometimes waiting 6-12 hours for a decent backhaul saves you $500 in fuel and puts you in a better position for your next load.
What's Still Driving 2026 Lane Rates
Understanding why rates are where they are helps you predict where they are going. Three forces still shape the Fall 2026 rate environment:
1. Capacity is tight. Over 100,000 carriers exited during the 2023-2024 freight recession, and most are not coming back. Insurance costs, equipment financing, and depleted reserves create barriers to re-entry. The FreightWaves SONAR Outbound Tender Rejection Index (OTRI) has run above 15% since mid-May 2026 — well above the soft-market trough. When carriers reject that share of tenders, shippers scramble for spot capacity and hot lanes pay up.
2. Seasonal demand is stacking. Produce season (Feb-June), construction ramp-up (spring), and front-loaded retail imports (tariff uncertainty) are all hitting at the same time. Each would move rates individually — together, they are creating a spring surge across equipment types.
3. Cost floors are rising. Diesel, insurance, and equipment costs have all increased, meaning carriers need higher rates just to break even. When cost floors rise and capacity tightens simultaneously, the rate recovery has legs. Our freight rate recovery analysis covers the macro trends in depth.
Fall–Q4 2026 Positioning Playbook
September through mid-December is when retail inventory, holiday ship windows, and remaining harvest freight stack on top of already-tight capacity. FreightWaves SONAR Outbound Tender Rejection Index readings have held above 15% since mid-May 2026, and the national van load-to-truck ratio was 9.38 in July (with a post–July 4 spike to 12.11). That is a shipper scramble environment — if you are still accepting February-era rate floors, you are volunteering margin.
Van / Q4 retail: Port clusters (LA/LB, Savannah, Charleston, NY/NJ) into inland DCs pay when import boxes deconsolidate. Book the outbound early in the week; Friday desperation loads look busy but often hide detention. Pair every outbound with a pre-planned inland return — Phoenix, Dallas, Atlanta, and Columbus remain useful relay hubs.
Reefer / late harvest: Florida strawberry is done; late apples, grapes, potatoes, and cold-chain retail keep Northwest and Mid-Atlantic reefers busy. Temperature claims destroy a week of good rates — service the unit before you chase a $4/mi produce ghost.
Flatbed / construction: IIJA-era highway and utility projects do not care that produce season ended. Charleston–Charlotte, Houston–Atlanta, Phoenix–Denver style pairs still clear $2.80–$3.40/mi when mills and jobsites are active. Tarping time is part of the rate — if the broker will not pay for it, the load is not premium.
Diesel reality check: EIA on-highway diesel was $5.257/gal for the week ending August 10, 2026 (2026 YTD average about $4.80). A $3.00 gross that looked fat at $3.50 diesel is thinner at $5.26. Recompute your floor weekly — our freight rate recovery 2026 page walks the ATRI cost math.
How to Audit a Lane in 15 Minutes (2026 Method)
- Pull DAT/Truckstop lane history for the last 30–90 days — note median and 75th percentile, not the hero post.
- Subtract your real cost/mi (fuel at current EIA, insurance, truck payment, maintenance reserve). If the median does not clear a 15–20% cushion, skip unless it positions the next load.
- Check broker credit / days-to-pay before you fall in love with the rate.
- Price deadhead both ways. A $3.80 headhaul with 40% empty miles can lose to a $2.90 loop that stays loaded.
- Call two brokers with a counter anchored to the 75th percentile — posted board rates are opening offers.
If that workflow eats your day, that is the product problem load boards create. A dispatch desk that already knows which brokers clear on your equipment is usually cheaper than burning hours for the same answer.
The Bottom Line
Mid-to-late 2026 is the strongest rate environment for many truckers since 2022 — but only on the right pairs. Chase live DAT floors, not last spring's screenshots. Reefer for remaining harvest and cold-chain retail, Laredo/El Paso if you sit on the border, CARB-compliant California outbound for van premiums, flatbed construction for steadier weeks, and Q4 retail port-to-DC for van volume. Diesel near $5.26 means the gross rate has to work harder than it did in Q1.
Most importantly, plan your backhauls before you accept the headhaul. A $4.50/mile load from Plant City to New York is great — unless you deadhead 1,100 miles back empty. That $4.50 load just became $2.60 per loaded and deadhead mile combined. Our dispatch team specializes in building complete route strategies — not just finding loads, but sequencing them so every mile earns money.
Related Resources
- Produce Season Trucking Guide — Month-by-month harvest calendar for reefer carriers
- Seasonal Freight Calendar — Rate trends and demand patterns across all equipment types
- Freight Rate Recovery 2026 — Where dry van spot stands after passing contract
- Reduce Empty Miles — Strategies to cut deadhead and boost revenue
- Deadhead Calculator — Compare backhaul vs. deadhead costs on any route
- Cost Per Mile Calculator — Factor all costs into your rate decisions
- Spot vs. Contract — When to chase spot and when to lock in contracts